Reading Your MyChron Speed Trace: Where You’re Really Losing Time
A speed trace is a graph of GPS speed across the lap. To find time, overlay two laps and look for three things: where your minimum corner speed is lower, where the trace stays at the bottom too long, and where it climbs late onto a straight. Those three patterns are where most kart lap time hides.
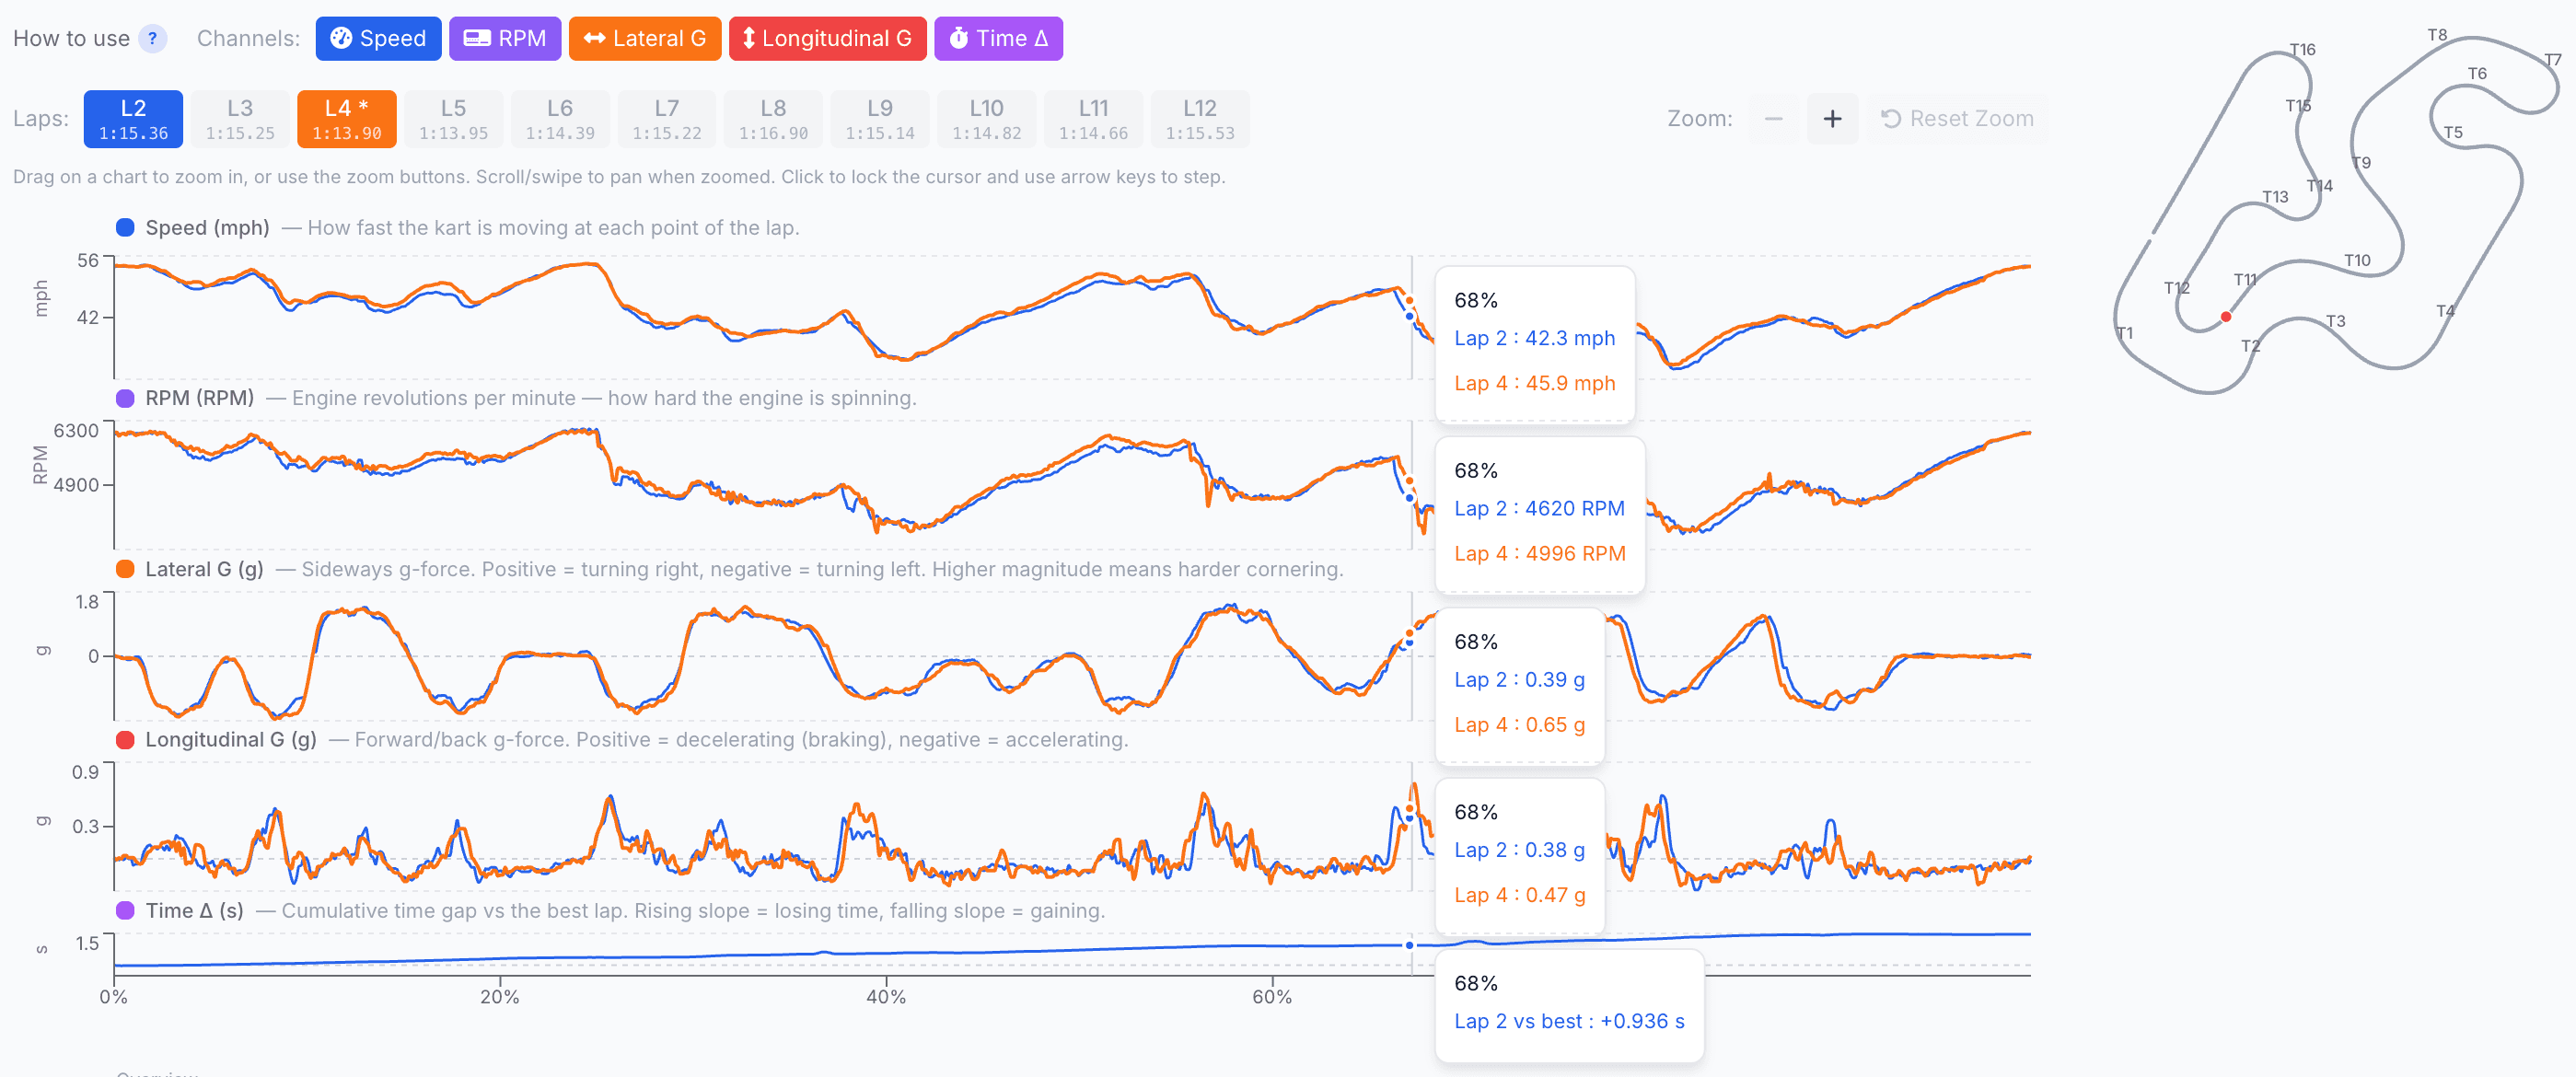
The speed trace is the most useful single view in kart telemetry, and it rewards a little practice. On its own, one lap just confirms your time. The magic happens when you put your fastest lap on top of a slower one and read the gaps. Here is how to do that.
How do I read a MyChron speed trace?
Read it left to right as a journey around the lap. Peaks are straights, where speed is highest. Valleys are corners, where speed drops to its minimum. The bottom of each valley is your minimum corner speed, one of the most important numbers on the page. Steep downward slopes are braking zones. Upward slopes are acceleration onto the next straight. Once you see the lap as a series of peaks and valleys, the rest follows.
What does the minimum speed tell me?
Minimum corner speed is the lowest speed you carry through a corner, and on a kart it is gold. A kart has no differential, so over-slowing the rear axle mid-corner scrubs speed and then makes the kart reluctant to rotate. If your fastest lap shows 52 km/h at the bottom of a hairpin and a slower lap shows 48 km/h, that 4 km/h is costing you down the entire next straight, not just at that point. When you overlay laps, a lower valley is often the clearest single cause of a lost tenth.
Note that we say minimum speed, not apex. The apex is a point on the track. The minimum speed is a number you can measure and chase. Speed Lab labels it Min Speed for exactly that reason.
Where am I really losing time?
Overlay your best lap against a slower one and look for these signatures, in order of how much they usually cost:
- Lower minimum speed. The valley on the slow lap dips below the fast lap. You scrubbed too much speed, usually from braking too hard or carrying the slow speed too long.
- A flat-bottomed valley. The trace sits at the bottom for too long instead of touching a minimum and rising. That is time spent slow that you cannot get back.
- Late acceleration. The upward slope out of the corner starts later on the slow lap. Every fraction of a second you delay getting back to power compounds down the straight that follows.
- A lower top speed. The peak on the straight is lower. This is often an effect, not a cause: a slow exit produces a slow straight. Fix the exit and the peak usually follows.
Why does a slow exit cost so much?
Because the penalty carries. A corner that leads onto a long straight is worth far more than a corner that leads into another corner, since a small speed deficit at the exit is multiplied over the whole straight. This is why, when you read a speed trace, you should weight the corners by what follows them. We go deeper on this in corner entry vs exit.
How do I know it is the driver and not the kart?
You cross-check with the other channels. If the minimum speed is low but lateral G is also low, the kart had grip to give and you left it on the table, that is a driver opportunity. If lateral G is already maxed out and the kart is sliding, you may be at the limit of the setup, and the answer is in the chassis, not the line. Reading speed alongside G is how you tell the two apart. The broader method is in how to read MyChron telemetry.
The fastest way to see this
Reading two overlaid traces by eye is a skill worth building. If you would rather have the biggest gaps flagged for you, Speed Lab overlays your laps, draws a rolling time delta, and its AI coaching report calls out the specific corners where the speed trace says you are losing the most. The live demo shows it on a real session, and finding lap time with data ties the whole method together.
See it on a real session
The quickest way to make this click is to look at real data. The live demo walks through a full kart session, speed traces, track map, sector deltas, and an AI coaching report, with no account needed.
Kart Track Team
Telemetry analysts at Kart Track
The Kart Track team builds Speed Lab, the telemetry analysis engine behind karttrackapp.com. We spend our days parsing MyChron and Alfano data and building the speed traces, track maps, and AI coaching reports that turn raw laps into specific, corner-by-corner feedback for kart racers.